


Over the past couple of weeks, I’ve been working on a pure Python library for rendering SVGs. In a spur of unbridled inspiration, I called it Tesserax. Long story short, it got waaayyyy beyond control, as it happens.
This article is a quick recap of why I did it, how I went down the rabbit hole of implementing yet-another-drawing-library, and a small showcase of what it can do it can do, in case you want to give it a shot.
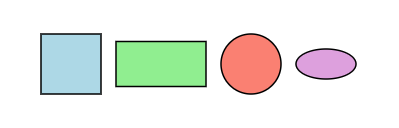
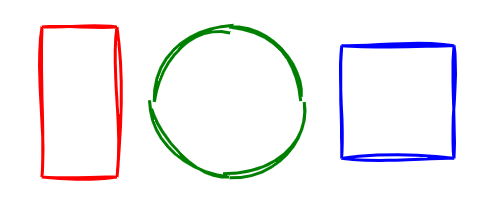
But before moving one, here is a minimal example of what you can do with a few lines of Python.
Are you curious now? Then read on!
The Case for Tesserax
There are a gazillion tools out there for drawing mathematical diagrams in Python, from the ancient, trustable matplotlib to the new cool kid in the park manim. There are a ton of charting libraries (those intended to draw bars, pies, and doughnuts) like altair and plotly; and a ton of high-level diagram makers like graphviz for graphs and networks, and mermaid for, well, whatever the mermaid devs think is worth drawing.
The problem with all these is that, one, there weren’t made by me. Now, jokes apart, I do believe there is a lot of value in reinventing the wheel, if only because you get to learn a lot about wheel—and boy have I learned more than I ever wanted to about SVG in the last couple of weeks. But also, you may find that your wheel fits your cart slightly better than all others, just because you know precisely what you need (and enough with wheel analogies).
So, I made Tesserax to cover a sweet spot that I couldn’t find anywhere: a lightweight library (literally zero dependencies, not even numpy) that renders web-native content (so everything scales and layouts perfectly in Jupyter / Quarto) and has both a very powerful low-level engine for when you want pixel-perfect control, and a very comfortable high-level engine for the most typical workflows.
Also, it should support animations. But I’m getting ahead of myself.
What Can Tesserax Do
I won’t put any code in this article because, one, Substack sucks at code. And two, it would only make the article harder to follow. All of these examples are fully described in the online documentation.
At its core, Tesserax is a library for defining an SVG scene. You create a Canvas, and some Shapes to it, define some attributes, and render it as an SVG file. Simple enough1.
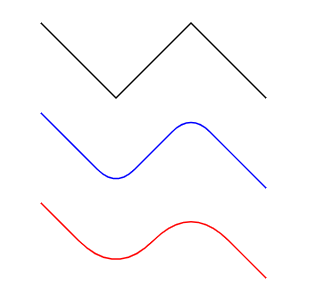
Beyond basic primitives, you can of course draw arbitrary paths and style them easily. Here is a Polyline primitive that allows controlling the curvature with a smoothness factor.
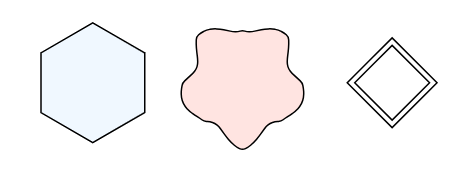
You can control and distort these shapes in any form you want, including fully procedural warping of the edges.
And, of course, since no mathematical drawing library is worth a penny without a sketchy mode, you can also do that (albeit with some constraints).
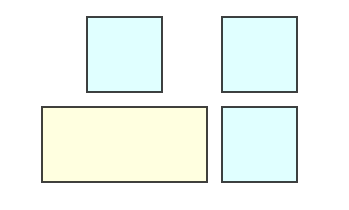
To make positioning and layout easy, Tesserax comes a set of builtin layouts (that of course can be extended in any way you want, it’s Python) for common patterns like rows, columns, grids…
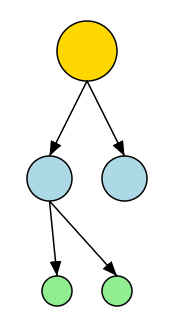
And a couple of complex layouts for things like trees and arbitrary graphs.
But things start to get really interesting when you discover that if you can render an image from code, then you can render as many as you want! And that leads to… animations!
Tesserax animations are procedural, meaning you write code that defines how each object changes in time. But there is a very high-level API for defining and composing animations declaratively, which means you seldom need the full power of tweaking each shape properties (but that power is there when you need it, as it should).
And, of course, once you grok animations, the next immediate idea is physically-based animations. (This is where things got way out of control, as you may imagine). Tesserax comes with a very small but fully-fledged pure Python 2D physics engines—that was a mouthful.

It can resolve collisions among arbitrary objects (using circles and rotated boxes as approximate colliders) and simulate fixed-step rigid body mechanics. Physic animations are baked—which means you compute the animation once and then render it. So, no, no 2D games for you! What were you thinking about? This is a graphing library, for Turing’s sake!
The purpose of this physics engine is, once again, didactic—e.g., to explain physics concepts in a Jupyter notebook with a bit of shizzass.
Final Words
I started writing Tesserax to help me create diagrams and animations for my lectures and articles. But when you do that with a fully-fledged programming language things start to get really interesting, because now you can leverage your well-honed programming skills to create complex diagrams with the minimum necessary code. You can encapsulate repeatable patterns into classes and methods, and build impressive diagrams bottom-up. You can abstract common patterns into drawable concepts like trees, automatons, etc.
For example, in the docs you will find a bit of code to implement a blob-like simulation by creating a ConvexHull component that automatically tracks inner shapes and builds the convex surrounding path around them. Tied with some simple physics (a bunch of balls interconnected with springs) gives you this ugly-looking blob of dread that I hope haunts your dreams for the next week or so—it sure will mine.
On a more serious note, the next step for Tesserax is building a library of reusable math and computer science concepts, like animated arrays, trees, graphs, etc., that can be used to explain complex CS topics with the much need visual assistance. As the great Donald Knuth once said, an algorithm must be seen to be believed. Tesserax is here to help you see them.
I’d really love if you guys would give Tesserax a try, now that is a bit more polished, and shoot me all your questions and suggestions. Special thanks to Wyrd Smythe for many insightful comments and suggestions (although I’m not sure I’ve totally addressed all of them :)
Sadly, among all the stupid things that Substack cannot do for the sake of being annoying, it seems rendering SVG is one of them. So all drawings in this article are dumb screenshots of what otherwise would be pixel-perfect, infinitely scalable SVGs.
Cool! Did you figure out the deal with cairosvg or code your way around it?
Good timing. I'm just getting back into a project that's complex enough I need some good process-flow and state diagrams to keep me sane. I'll check it out ASAP.